This is short project completed to ask 3 questions from the global spotify weekly charts. Several steps need to be completed, including creating a database, inserting a csv file and creating queries to answer questions.
Before conducting any of these steps the data must be looked at for clarity and make a plan for cleaning if needed.
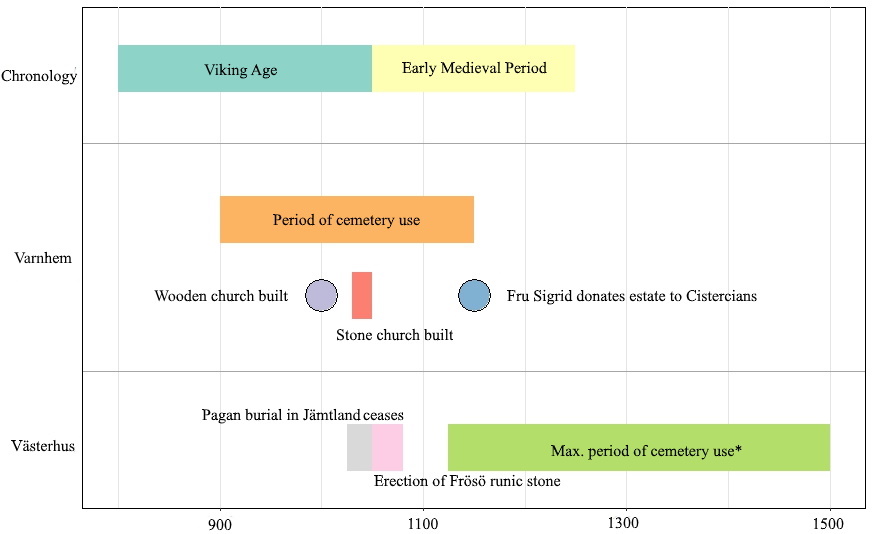
This schedule was used to understand how Christianity was brought to different parts of the country. Here we compared the timelines of two sites from two different dioceses. At this time Västerhus was part of Norway and Varnhem was part of Sweden but had closer relations for Denmark.
Using this timeline, along with other data, we were able to see that Västerhus was a site where Christianity was part of the community so there was less variation in diet and mobility. Varnhem, on the other head, shows how Christianity was brought to the area and it welcomed more people who traveled further distances to partake. The high amount of non-local burials from outside a 30 km radius shows that people were traveling far distances to take part whereas in Västerhus the population was largely local and did not have to travel far.